


10 Most Imperative And Popular JavaScript Chart Libraries
In recent times, web developers are using advanced visual and dynamic effect to create modern web designs. By using animation properties of CSS3, developers have taken web design to another level.
JavaScript is known to be the king of front-end scripting. There is no doubt that it is one of the best scripting languages to develop visual effects by developers without using any backend programming language. Also, due to its cool features, JavaScript is used to create big data charts, tables, graphs and help to bring in dynamic effects by developers. So, it is even considered to be the top choice for developing websites with attractive visual and dynamic effects.
This article lists some of the best JavaScript Charting Libraries to develop graphs, tables, data chart, and many more effects. These will help developers to create dynamic and beautiful charts which will further enhance the look of the website.
Some open source JavaScript Libraries are included in this article, some libraries are free to use and some paid versions that provide additional library features. A large amount of Best JavaScript frameworks and Libraries are available in the market. Most flexible JavaScript charting libraries are developed and used to meet the needs of the clients and to solve issues related to web development. Some JavaScript Libraries are very powerful that can be incorporated in the web development cycle to give superior and vibrant effect fittingly.
Let’s take a look for best javaScript charting libraries those are highly imperative and popular.
-
Data-Driven Documents – D3.js
The first name that strives to the developer’s mind while thinking of charting in today’s world is the D3.js JavaScript Charting Library. The D3.js has rich and powerful features; the developer may not find these features in other existing libraries. Unique features like entering and Exit, powerful transition effects, Syntax similarity, and others.
Syntax familiarity with jQuery is one of the best JavaScript Charting Libraries. If you want to represent charts on the websites, you can easily do it using CSS, HTML, and SVG. They make use of DOM [Document Object Model] to transform data into a visual representation. D3.js is one of the widely used charting libraries by developers across the world. There are no pre-built in charts available in the D3.js library, but you can look at the graphs that are developed using D3.js.
One of the drawbacks of D3.js Library is that it does not perform well with older browser version like the IE8. For better browser compatibility the developers can make use of plugins.
Here are some of the companies that have used D3.js Charting Libraries in recent times for creating websites are –
- NYTimes
- Uber
- Weather.com
-
Google Charts
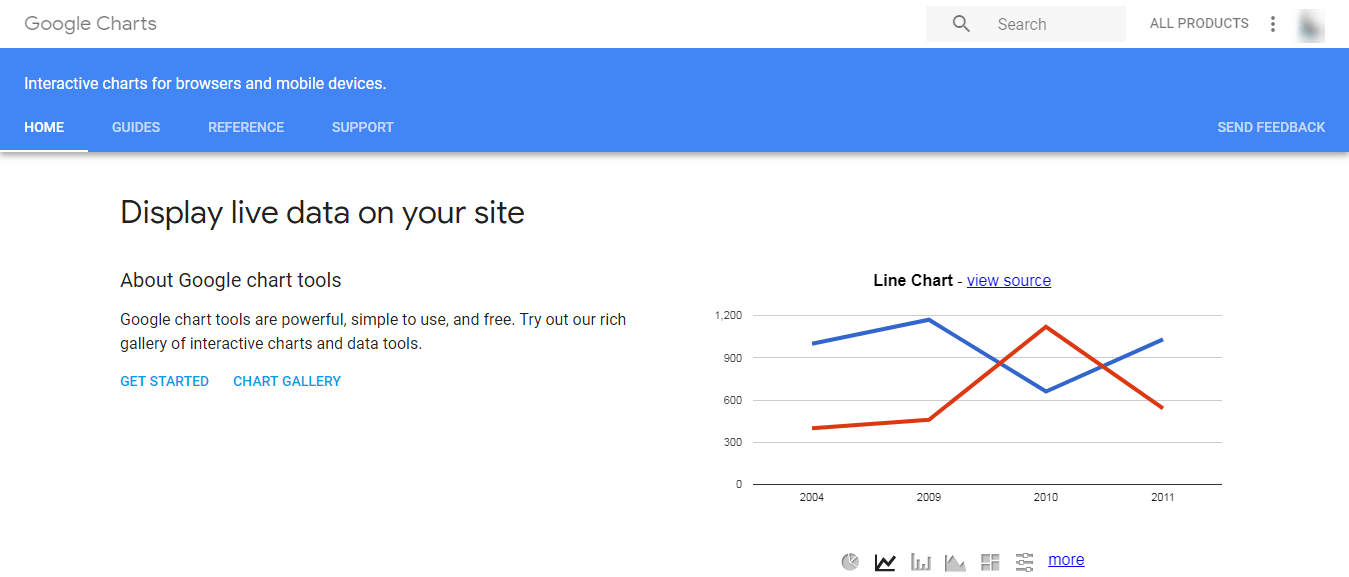
One of the most natural ways of creating charts is by using Google Charts. It is a JavaScript library that is embedded with many pre-built charts like bar charts, calendar charts, area charts, geo charts, pie charts, and many other multi-functional charts. Developers can create the most basic charts using Google Charts.
Developers use JavaScript Chart visualization library to give a visual effect to the charts and they can even change the look of the graph. Charts are represented using HTML5 or SVG languages that offer browser compatibility and platform portability among various platforms like iPhones, Android, and iPads. Google Charts makes use of VML to support older browser version of Internet Explorer [IE].
Some of the charts that are built using Google Charts are mentioned below.
- Geo Chart
- Scatter Chart
- Stepped Area Chart
- Bubble Chart
- Area Chart
- Org chart
- Treemap
- Guage
- Timeline
To use Google chart in your web application, the developers should be familiar with JavaScript, CSS, HTML and should be able to use any of the text editors. Google Charts are simple and easy to learn.
-
Chart.js
For developers and web designers, one of the most straightforward JavaScript Charting libraries is the Chart.js. It offers beautiful chart designs for developers. It is compatible with older browser version of IE7 and IE8 due to the use of polyfill. The Chart JS are user responsive by default and works well in tablets and mobiles. It is another vital open source charting library for developers, which is widely used in recent times, is Chart JS. It can be represented by using HTML5 with the added feature of dynamic effects and canvas effects. You can see here github Chart.js releases notes.
Some of the core charts of Chart JS are as follows.
- Bar Charts
- Doughnut
- Radar Charts
- Line Charts
- Polar area Charts
- Area charts
- Scatter Charts
-
Chartist.js
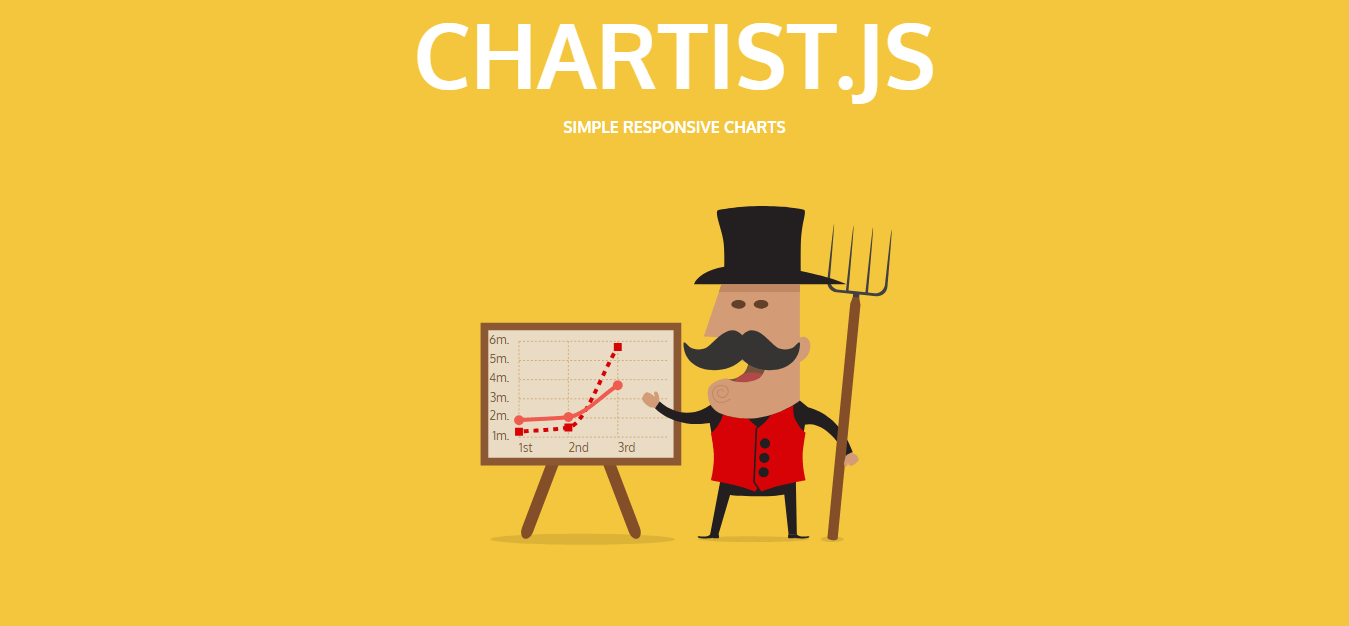
Similar to Chart JS it offers beautiful user responsive charts. Chartist.js inherits the properties of high priced JavaScript chart libraries and is the product of these libraries developed by communities to overcome some of the drawbacks of existing libraries. To represent the charts in the website, the developers use SVG and can be controlled as well as customized using CSS3, media queries, and SaaS. The animation tools of Chartist.js works well with modern browsers and are only 10 kb in size.
Some of the websites that use Chartist.js are
- unilever.com
- learn.uaex.edu
- usapa.org
- fac.luther.edu
-
Sigma js
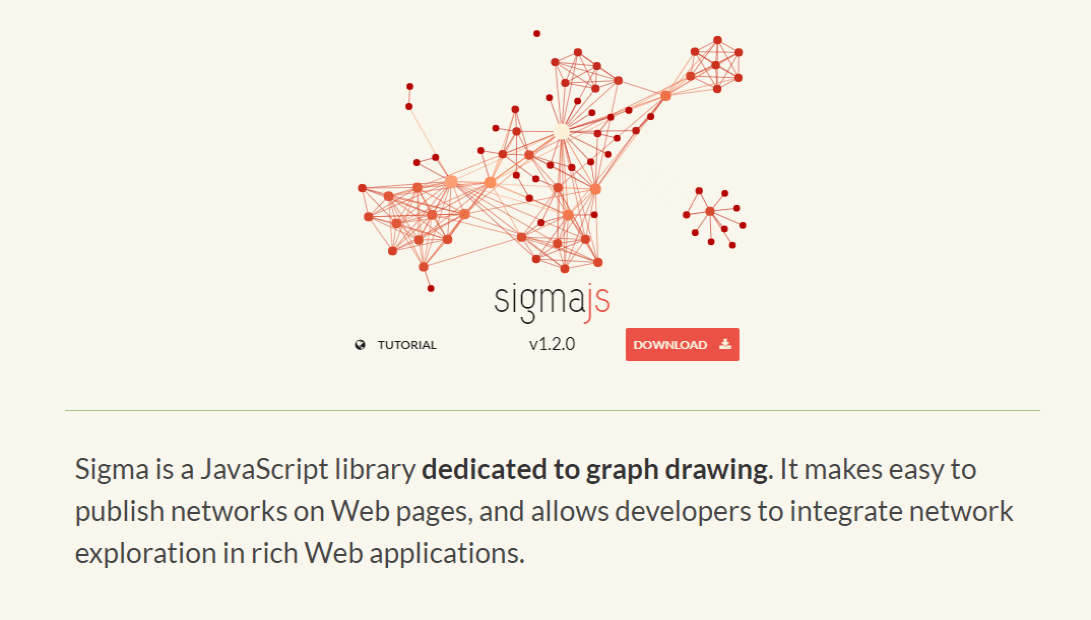
Sigma js is a JavaScript Chart Library that was primarily developed for drawing graphs. Sigma offers various setting options for developers to customize and to interact with networks. It allows developers to add their functions directly into the scripts to represent nodes and edges in the way you want them to.
Some of the features offered by Sigma are
- Canvas
- Mouse and Touch Support
- WebGL
These features provided by sigma allow users to do smooth and fast network manipulation on their web pages. With the help of sigma, it makes developer publish networks on their web pages. It also enables developers to interact with network searches.
-
n3 Charts
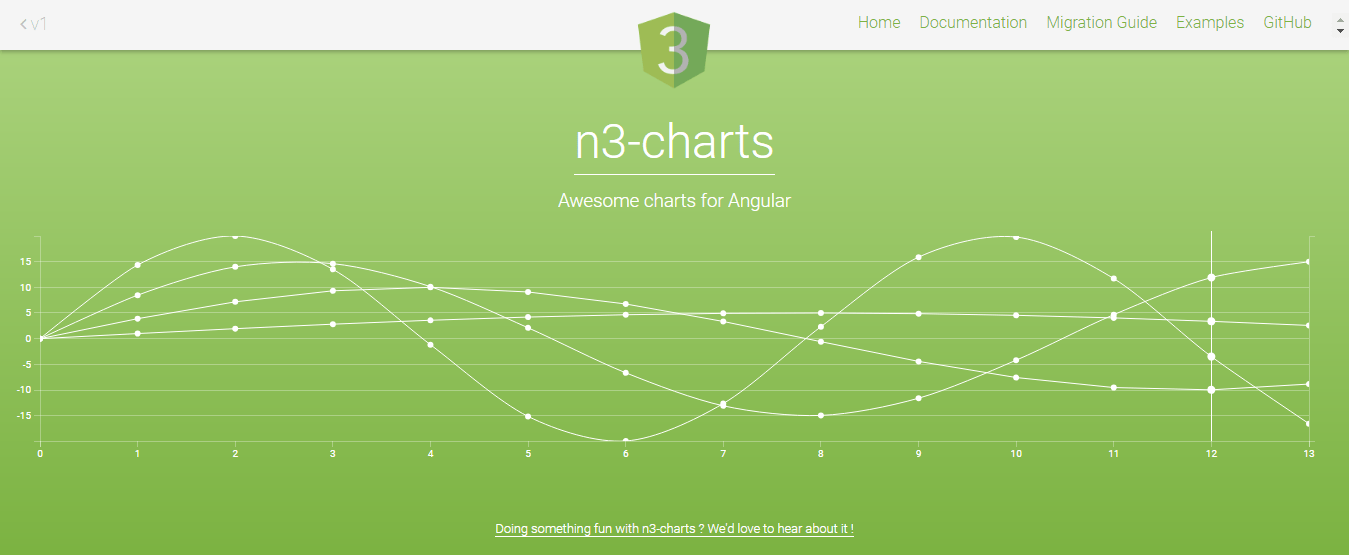
Angular web developers can make use of n3 charts on their websites; they are very much appealing to use and also useful in websites. It is a product of D3.js and Angular. Different types of standard charts are provided to developers in the form Angular directives.
List of some charts that are built using ns charts.
- Line series
- Time Series
- Area Series
- Dot Series
- Interpolation
-
HighCharts JS
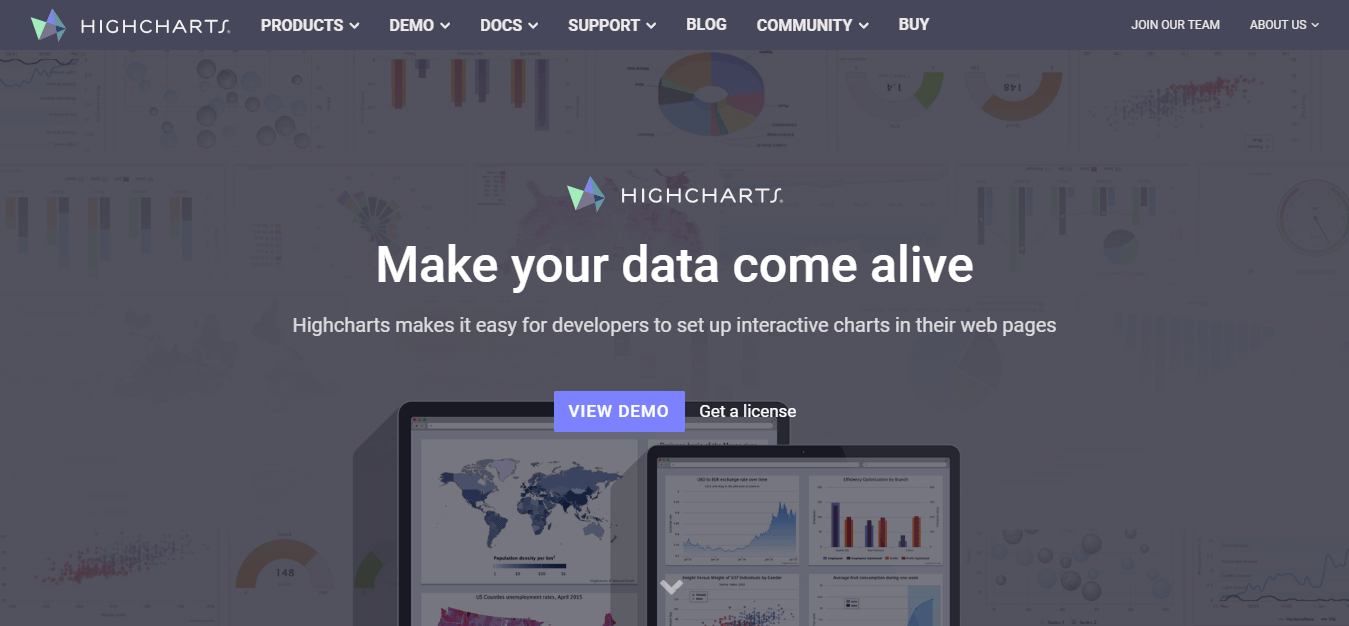
One of the most popular types of JavaScript chart library for developing graphs is Highcharts JS. Highchart is one of the most straightforward and flexible JavaScript charting API in the market. Many animations tools are preloaded in highcharts. If these tools used by developers, they will help to enhance the look of the websites and may attract many people. Some of the packages that are available in Highcharts are Highstocks, financial charting package and great maps for geo maps.
One of the advantages of using HighCharts on websites is because of its compatibility to support old browsers. It is compatible with IE6. To implement graphs in standard browsers, the developer needs to use SVG. In the internet, explorer graphs are drawn using VML. For personal use, you can use HighCharts JS for free, and if you want to use it for commercial purpose, you need to purchase the licensed one.
Some of the graphs that are preloaded in Highcharts are
- Spline graph
- Areaspline graph
- Column graph
- Pie graph
- Scatter graph
- Bar graph
- Area graph
-
FusionCharts
One of the oldest JavaScript Charting libraries is the Fusioncharts. It was developed and released for use in the year 2002. The charts are drawn using HTML5 or SVG and VML that offers better compatibility and can be carried easily and implemented on other systems. With the help of JSON and XML language, the parsing of the data is done in Fusioncharts.
These charts can be exported into three different file formats namely
- PNG
- JPG
Fusioncharts are more compatible with old browsers like the IE6. Due to the compatibility features, it gained enormous popularity for over a long period and was one of the top choices of developers. It consists of almost 95 charts and around 1400 or more maps that can be used for web application and mobile applications. The visualization of charts is animated and made more interactive. They are represented using SVG and VML in IE 6 or 7 or 8. The Fusioncharts package includes packages like FusionWidgets, Powercharts, and FusionMaps. New fusionchart version consists of three themes and also supports spline and spline area while implementing combination charts in applications.
-
Flot
Flot is JavaScript charting library mainly for jQuery developers. It is considered one of the oldest and most popular JavaScript Charting libraries. It is compatible with older browser versions and works well with Internet Explorer 6, Firefox 2. Compared to other JavaScript charting libraries it is getting a bit old in due times, but it is still working to check it out. It supports various charts like line charts, bars charts, filled areas charts, pie charts and a stacked chart. You can also combine these graphs in your web applications. Some charts require using plugins as stacked chart needs to jquery.flot.stck.js plugin to use and pie chart needs a jquery.flot.pie.js plugin to use. The new version of Flot is developed and all plugins are being integrated to reduce the use of external plugins for some charts.
With the help of flot, the developer can build animated plotting graphs. Developers can use flot for free and in case the developers need some commercial support that can be offered by the creator on request.
Some interactive features of Flot.
- Charts support zooming functions to know more specified and detailed information
- You can hide dataset if there is more than one dataset in one chart
- You can update the chart within the given time frame, mainly used to show online users
-
Pizza Pie Charts
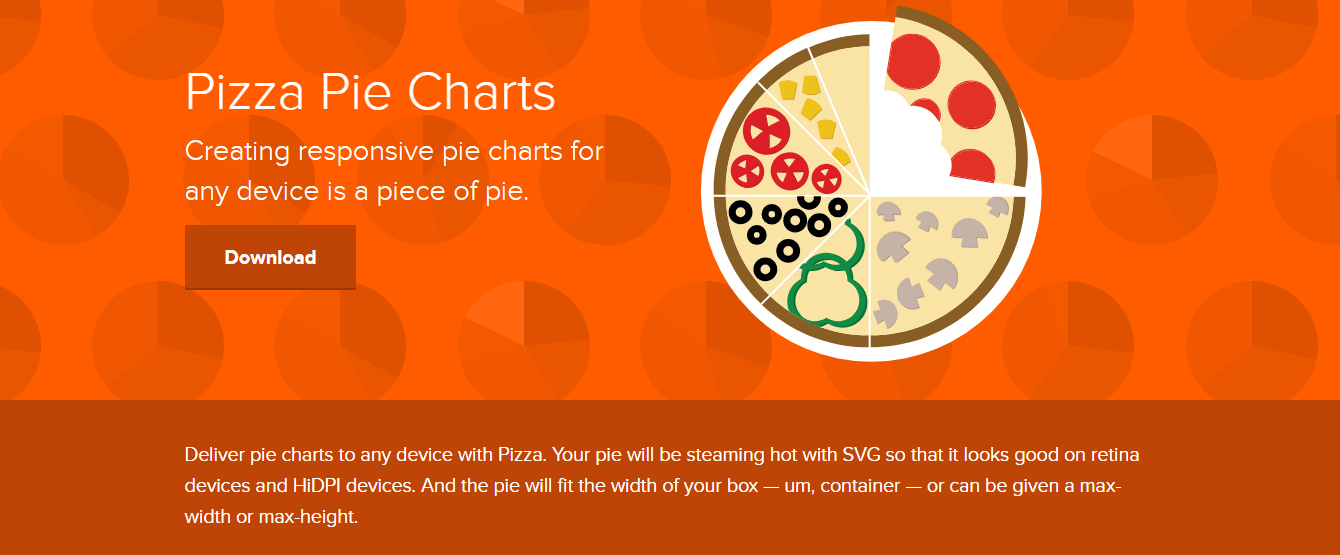
Pizza chart is developed by ZURB, which is a well-known design agency that releases the open source code for free. The open source code is primarily used by developers to build frontend web applications. It is used most commonly to make pie charts using SVG. The display setting can be changed in CSS or JavaScript. ZURB offers high-quality libraries to its users across the globe. The pie chart is used to represent data in a pie chart.
Other Charting Libraries
Listed below are some charting libraries that are available for developers, you can check them they are worth.
- Dygraphs – Initializing the code in Dygraphs is simple and can take the graph on your web pages with less effort. The dataset can be plotted on various graphs. Dygraphs consist of a gallery that has a series of graph styles.
- Protovis – one of the most complex data chart libraries is the protovis JavaScript Chart library.
- C3.js – C3.js is an open source library that is based on D3.js. With the help of C3.js, you can easily represent data into HTML web page. The data is represented dynamically and can be customized. C3.js offers great documentation to its developers and if you are good at JavaScript, it’s easy to use them in your web application.
Important Takeaways
The JavaScript Charting Libraries listed above are from both the recent and older charting libraries. The developers can select and pick any one of them in their web applications to give powerful effects to their app project.
The developers can also search for other JavaScript libraries but one of the most popular JavaScript library used by most developers is the D3.js. If the developer wants to have the full control over the charts, then he needs to consider using D3.js in his application. D3.js JavaScript Chart libraries can be used to draw a simple line and bar graphs. The JavaScript libraries mentioned above are more than sufficient for an average developer.
Conclusion
The above library charts offer powerful solutions and tools to visualize the data which makes web applications to be more interactive. To grow your business, the developer needs to implement the right mechanism more appropriately. Web developers can face some problems while implementing the provided tools in their web application but various web development companies extend their support to solve your problems and guide you to use the right tool.